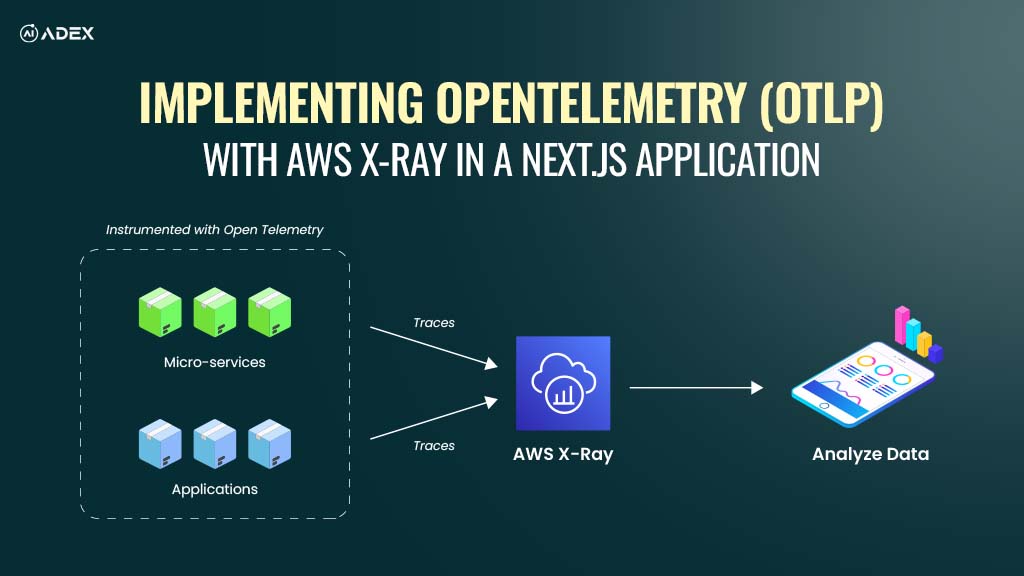
Implementing OpenTelemetry with AWS X-Ray in a Next.js Application

Written By Anup Giri
Mar 20, 2025
A skilled software developer with a passion for building scalable applications and exploring cutting-edge technologies. He specializes in designing efficient, high-performance solutions and enjoys sharing his knowledge through insightful guides and tutorials. His expertise helps developers overcome real-world coding challenges, adopt best practices, and stay ahead in the ever-evolving tech landscape.
Latest Blogs
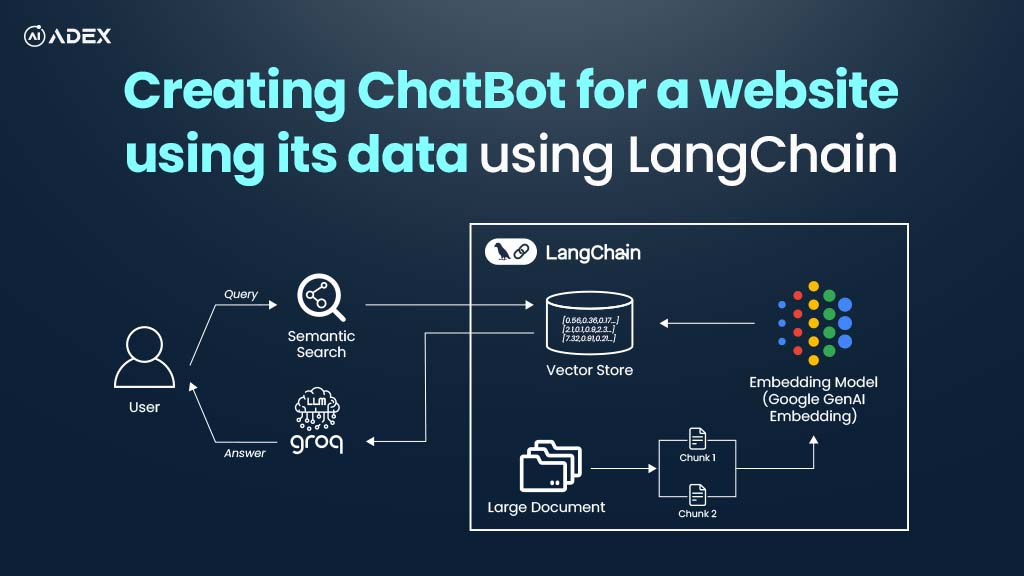
Creating Chatbot For Website with LangChain and Groq
Chatbots are transforming the way users interact with websites and services, helping them navigate c...

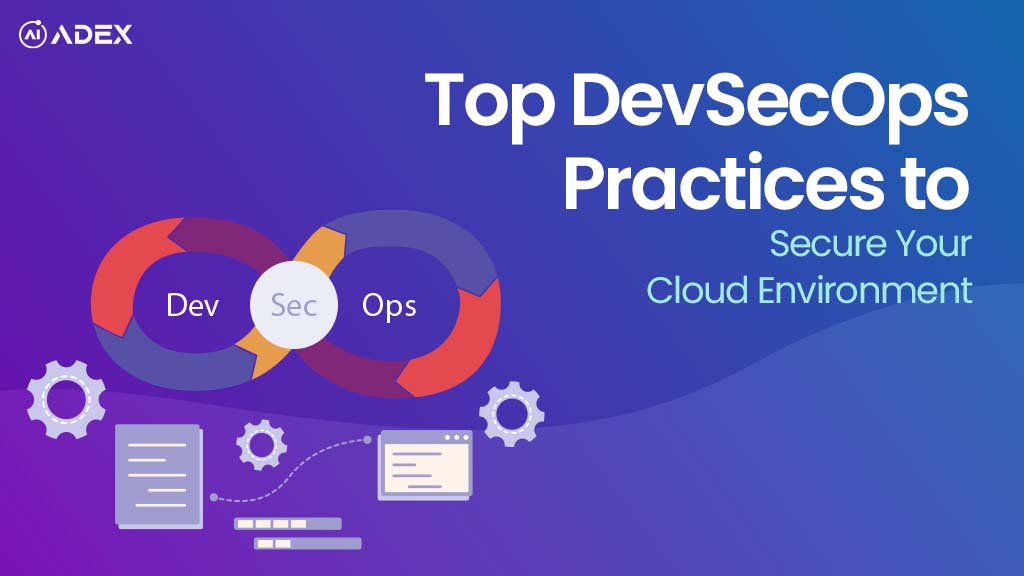
Top DevSecOps Practices to Secure Your Cloud Environment
Cloud pipelines evolve rapidly, but every new feature can introduce hidden security risks stemming f...

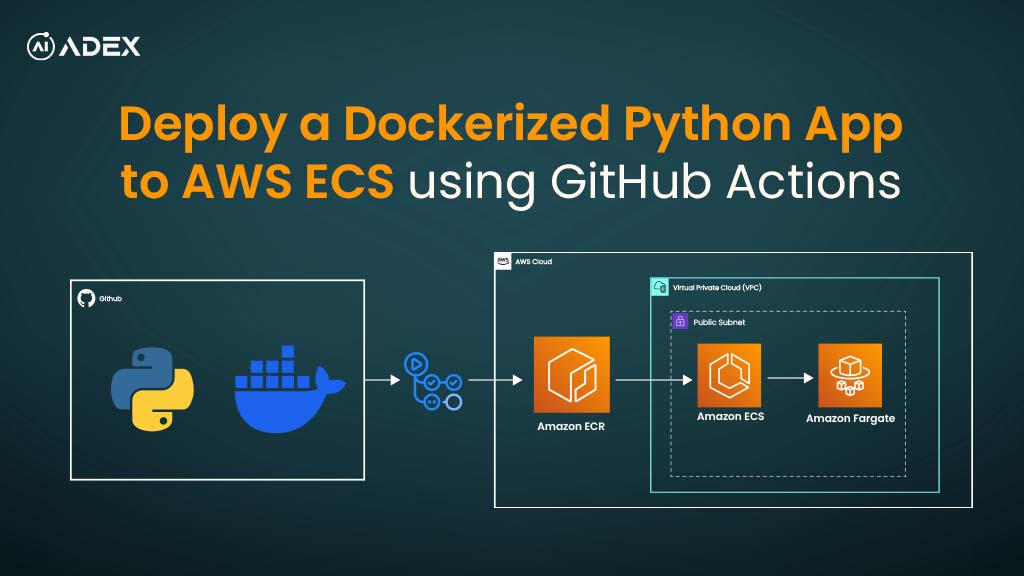
Deploy a Dockerized Python App to AWS ECS Using GitHub Actions
Deploying applications to the cloud reliably can be challenging due to inconsistent environments, sc...
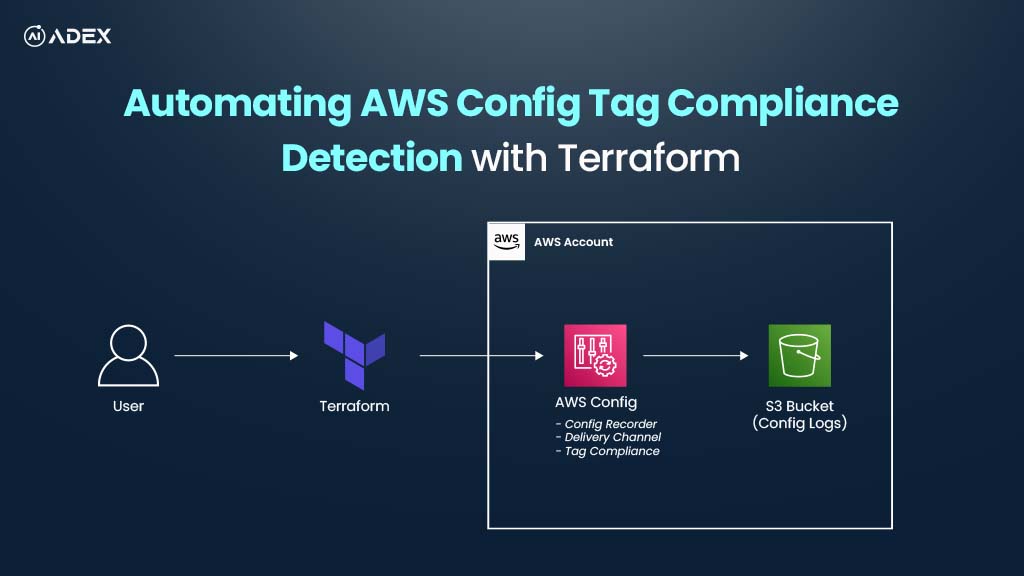
How To Automate AWS Resource Tag Compliance Checks with AWS Config and Terraform
Consistent tagging of AWS resources is vital for governance, cost management, security audits, and o...

AWS Monthly Updates – July 2025: GenAI, Free Tier Boost, and Deployment Enhancements
Redefining what’s possible in the cloud, AWS rolled out its July 2025 updates aimed at accelerating...
Steps to Purchase AWS Reserved Instances: Cut EC2 Costs with Confidence
Did you know businesses can save up to 72% on EC2 costs simply by choosing the right pricing model?...


Generative AI Consulting Services: Launch Your Business to New Heights with AI
The pace of business transformation has never been faster, and customer expectations are shifting by...


AI & ML Services for Modern Businesses: Benefits, Service Categories and Partner Evaluation
AI and ML are no longer emerging trends; rather, they are transformative capabilities driving busine...

Offshore Development Centers: Your Guide to Success
Offshore Development Centers (ODCs) are increasingly viewed as a strategic and effective means for f...
Purchasing AWS Savings Plans (1 or 3 year): Step-by-Step Guide for Cloud Cost Optimization
Managing AWS costs has become a top priority as cloud spending continues to outpace other IT expense...